
In this blog post, I am focusing on interpreting spikes on a candlestick chart. In a candlestick chart, the open, close, high and low are all visualized at a glance. There is enormous value in this when you’re assessing what the market has done over a period of time, or what you think it might do next.
The spikes high or the spikes low in a candlestick price bar have a story to tell. A strongly up-trending market is made up of bullish candles, but if one of those bullish candles produces a large spike above the close, is that bullish or bearish? Also, what’s the story if that same up-trending market produced an extreme spike lower on a bullish candle? There are dozens of different “spike” scenarios, and there is information in every one of those price bars.
There is meaning in the spikes.
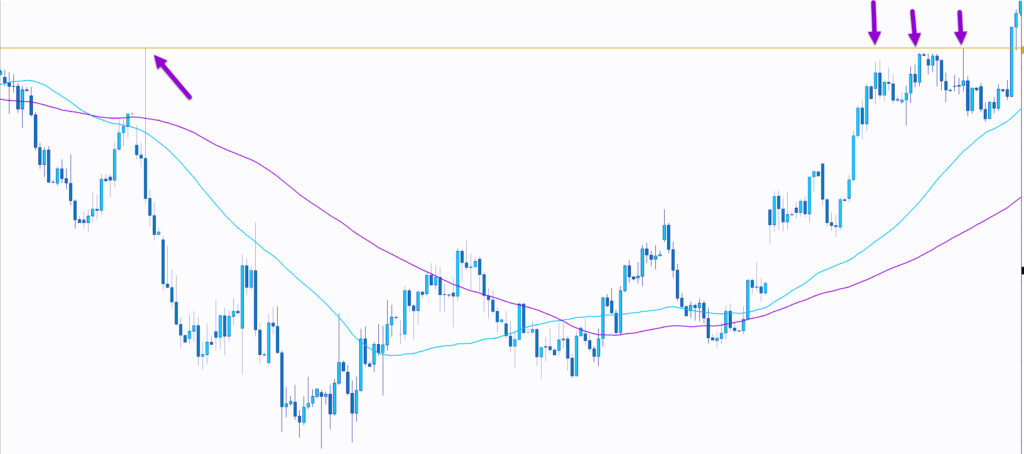
Whether or not it’s bullish or bearish, at some point in time the market will attempt to trade at those extreme highs or lows that were pointed to with the spikes. The spike is an attempt and it’s relevant.
What can we learn from the spike?
A candlestick captures price action over a specific period of time such as 1 day per candlestick, 4 hours per candlestick, 5 minutes, etc. It is fascinating is that the patterns produced by the candlesticks have the same meaning whether it’s a day chart, or a 5 minute chart. Of course, the day charts are making patterns more slowly and cover a greater distance than the shorter time frames. But, the fact that the patterns have similar relevance is baffling!
There are only 4 things you need to remember when you look at a price bar.
Open. Close. High. Low.
These 4 points make up all of our technical indicators, and these 4 points are all we have to determine what the market is dong now so we can anticipate what it might do next.
Don’t gloss over this just because it’s basic.
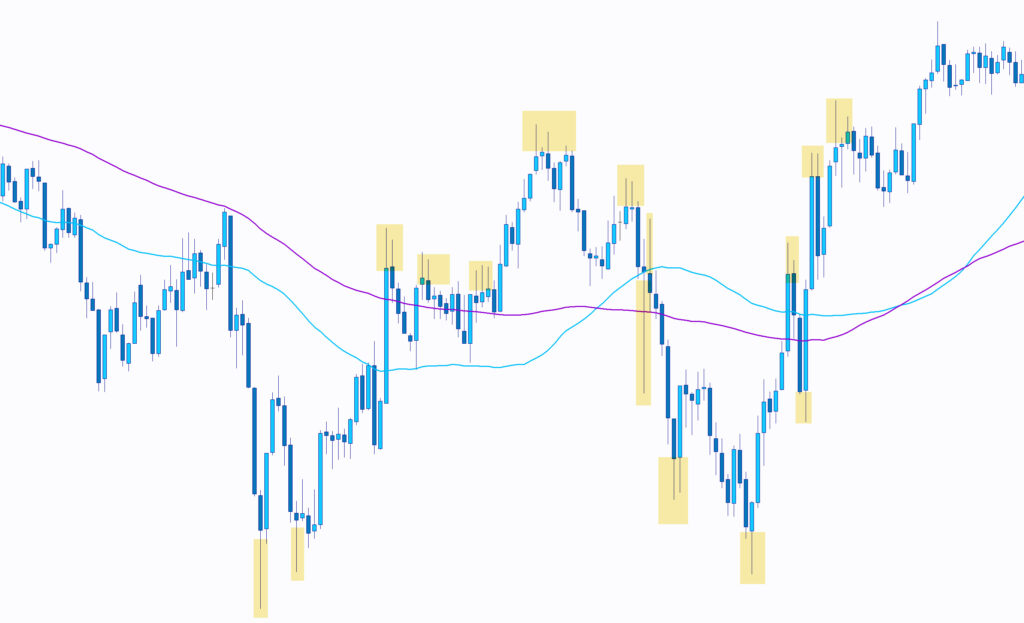
A price bar is either bullish or bearish, and it either has spikes or no spikes. When a price bar throws out a spike, pay attention.
A long spike on a candlestick price bar is showing you the market made an attempt to aggressively move in that direction. Pay close attention to what happens next.
If there is a second attempt, there is increased probability of pushing past that spike with momentum. Conversely, if there is no second attempt to challenge that high/low of the spike, a reversal may be anticipated as the spike found a point of complete rejection.
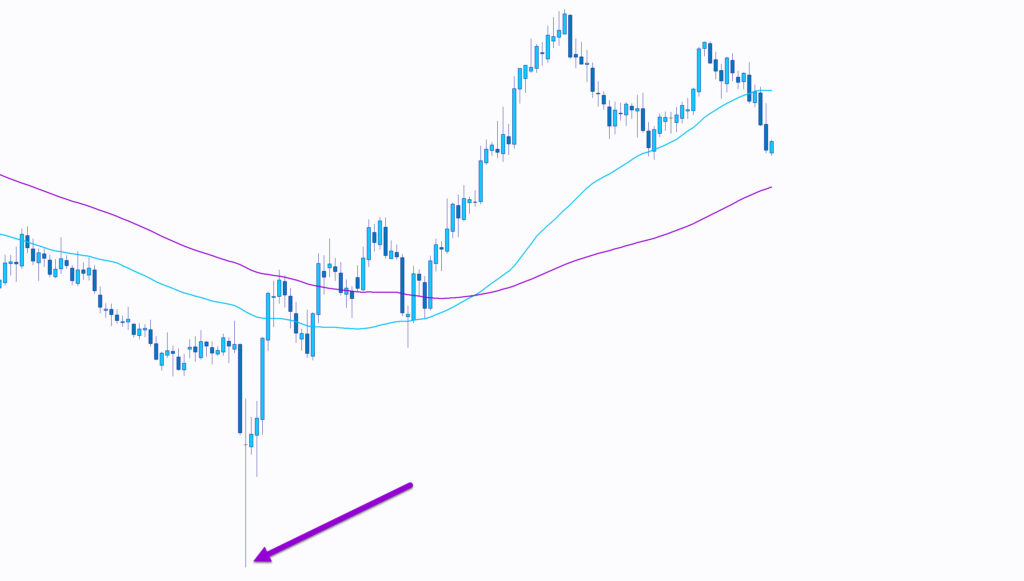
Don’t forgot about the level of rejection that a spike points to. Even if the market does aggressively reverse after hitting the high or low, there is a good chance price will revisit that level again.
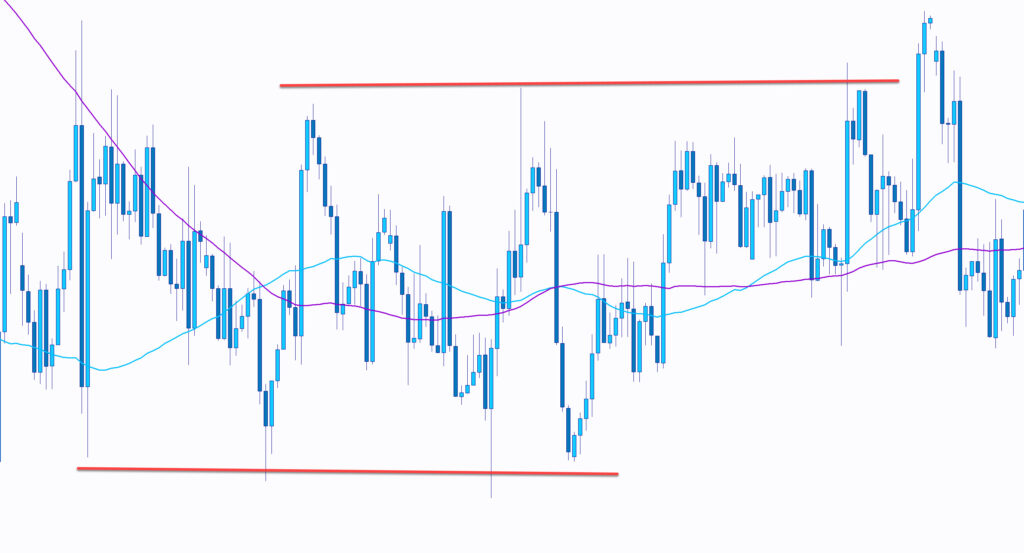
This is obvious in a range pattern such as the one in the image above, but it’s also true when the market slips out a spike, giving us a peak at a future price level.
In the example above, after spiking aggressively to a price 370+ pips higher than the close of that candle, price fell for another 600 pips. But, then it found it’s way back to the very level of the first “random” spike.
There is information in the spikes. Pay attention and you might find clues that help you as you plan for your future price targets.